12 Urbanization
Hannah Ritchie and Max Roser
Urbanization Across the World
For most of human history, most people across the world lived in small communities. Over the past few centuries – and particularly in recent decades – this has shifted dramatically. There has been a mass migration of populations from rural to urban areas.
How many people live in urban areas today?
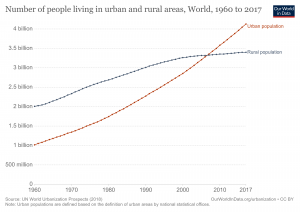
In the visualization we see estimates from the UN World Urbanization Prospects on the number of people globally who live in urban and rural areas. In 2017, 4.1 billion people were living in urban areas.
This means over half of the world (55%) live in urban settings. The UN estimates this milestone event – when the number of people in urban areas overtook the number in rural settings – occurred in 2007.
How does the share of people living in urban areas vary between countries?
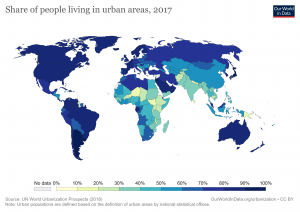
In the map shown here we see the share of the population that is urbanized across the world.
Across most high-income countries – across Western Europe, the Americas, Australia, Japan and the Middle East – more than 80% of the population live in urban areas. Across most upper-middle income countries – in Eastern Europe, East Asia, North and Southern Africa, and South America – between 50% to 80% of people do. In many low to lower-middle income countries, the majority still live in rural areas.
What we know about urban populations and why it matters
- globally more people live in urbanized settings than not (disputes in these figures are all above the 50 percent urban mark);
- the broad distribution and density of where people live across the world (sometimes at very high resolution);
- although it can seem like our expanding cities take up a lot of land, only around 1% of global land is defined as built-up area;1
- rates of urbanization have been increasing rapidly across all regions (in 1800, less than 10 percent of people across all regions lived in urban areas);
- urbanization is expected to continue to increase with rising incomes and shifts away from employment in agriculture;2
- disagreements in urban population numbers arise from definition or boundary differences in what makes a population ‘urban’.
Whilst disagreement on the numbers can seem irrelevant, understanding cities, urbanization rates, the distribution and density of people matters. The allocation and distribution of resources — ranging from housing and transport access to healthcare, education, and employment opportunities — should all be dependent on where people live. Understanding the distribution of people in a given country is essential to make sure the appropriate resources and services are available where they’re needed.
The UN’s 11th Sustainable Development Goal (SDG) is to “make cities inclusive, safe, resilient and sustainable“. If our aim is to develop resource-efficient, inclusive cities, understanding how many people they must provide for is essential for urban planning.
How is an urban area defined?
In the table below we highlight the varied definitions across a selection of countries. The UN World Urbanization Prospects database also provides the full downloadable list of statistical definitions for each country.
The table illustrates the broad range of definitions between countries which compromises cross-country comparisons. And since the reported global figure is simply the sum of nationally-reported shares, the lack of a universal definition is also problematic for these aggregated figures.
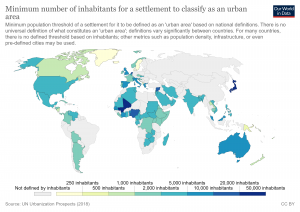
Even if we could define a single metric to use — such as a minimum population threshold in a settlement — countries adopt very different threshold levels. In the chart below we have mapped the minimum population threshold for countries who adopt this within their definition of ‘urban’. 2000 and 5000 inhabitants were jointly the most frequently-adopted threshold. However, the variation across countries was vast. Sweden and Denmark set this threshold at only 200 inhabitants; Japan at 50,000 (a 250-fold difference).
National definitions of ‘urban area’ as used for a custom selection of countries6
| Country | National definition of ‘urban’ |
|---|---|
| Argentina | Localities with 2,000 inhabitants or more. |
| Sweden | Built-up areas with 200 inhabitants or more and where houses are at most 200 metres apart. |
| Japan | Cities defined as shi. In general, shi refers to a municipality that satisfies the following conditions: (1) 50,000 inhabitants or more; (2) 60 per cent or more of the houses located in the main built-up areas; (3) 60 per cent or more of the population (including their dependents) engaged in manufacturing, trade or other urban type of business. |
| India | Statutory places with a municipality, corporation, cantonment board or notified town area committee and places satisfying all of the following three criteria: (1) 5,000 inhabitants or more; (2) at least 75 per cent of male working population engaged in non-agricultural pursuits; and (3) at least 400 inhabitants per square kilometre. |
| Zimbabwe | Places officially designated as urban, as well as places with 2,500 inhabitants or more whose population resides in a compact settlement pattern and where more than 50 per cent of the employed persons are engaged in non-agricultural occupations. |
| Singapore | Entire population. |
| Uruguay | Cities officially designated as such. |
Urbanization over the past 500 years
How has urbanization changed over longer timescales – over the past 500 years?
In the map here we see how the share of populations living in urban areas has changed in recent curies. Data on urban shares dating back to 1500 are available only for select countries, with an estimated share at the global level. Using the timeline on the map (or by clicking on a country) you can see how this share has changed over time.
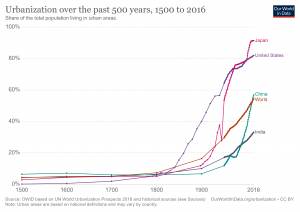
Here we see clearly again that urbanization has largely been confined to the past 200 years. By 1800, still over 90 percent of the global (and country-level) population lived in rural areas. Urbanization in the United States began to increase rapidly through the 19th century, reaching 40 percent by 1900.10
By 1950 this reached 64%, and nearly 80% by 2000.
This rate of urbanization was, however, outpaced by Japan. Urban shares in Japan were low until the 20th century.11
By 1900, it had just surpassed 1-in-10. This increased rapidly, reaching over half of the population by 1950; nearly 80 percent by 2000, and surpassing the USA to over 90 percent today.
China and India had not dissimilar rates of urbanization until the late 1980s.12 By then, both had around 1-in-4 living in urban areas. However, China’s rate of urbanization increased rapidly over the 1990s, and 2000s. Over this 30-year period its urban share more than doubled to 58 percent. India’s rise has continued to steadily rise to 1-in-3 (33 percent) today.
What share of people will live in urban areas in the future?
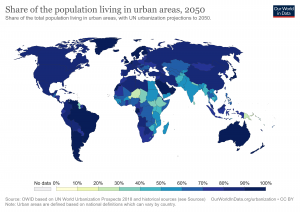
By 2050, more than two-thirds of the world will live in urban areas
The UN World Urbanization Prospects provides estimates of urban shares across the world through to 2050. These projections are shown in the chart — using the timeline you can watch this change over time.
Across all countries urban shares are projected to increase in the coming decades, although at varied rates. By 2050, it’s projected that 68 percent of the world’s population will live in urban areas (an increase from 54 percent in 2016). In fact, by 2050 there are very few countries where rural shares are expected to be higher than urban. These include several across Sub-Saharan Africa, Asia, Pacific Island States, and Guyana in Latin America.
Why, when most countries are expected to be majority urban, does the global total just over two-thirds? This seems low, but results from the fact that many of the world’s most populated countries have comparably low urban shares (either just over half, or less). For example, India (expected to be the world’s most populous country), is projected to have an urban share of only 53 percent in 2050.
Urban populations tend to have higher living standards
There are many examples — across broad areas of development — which suggest that, on average, living standards are higher in urban populations than in rural. Some examples include:
- in nearly all countries electricity access is higher in urban areas than in rural areas;
- access to improved sanitation is higher in urban areas;
- access to improved drinking water is higher in urban areas;
- access to clean fuels for cooking and heating is higher in urban areas;
- child malnutrition is lower in urban settings.
Note, however, that it is difficult to infer causality between urbanization and these examples. Since urbanization shows a strong correlation with income, such relationships may instead simply show the effect of higher incomes on electricity access, sanitation, drinking water and nutrition. Furthermore, there can also be significant inequalities within urban areas; this is evidenced by the fact that across many low-to-middle income countries a high share of the urban population live in slum households (which lack access to all of the basic resources).
