7 Solid and Hazardous Waste
Silpa Kaza, Lisa Yao, Perinaz Bhada-Tata, and Frank Van Woerden
At a Glance: A Global Picture of Solid Waste Management
Key Insights:
• The world generates 0.74 kilogram of waste per capita per day, yet national waste generation rates fluctuate widely from 0.11 to 4.54 kilograms per
capita per day. Waste generation volumes are generally correlated with income levels and urbanization rates.
• An estimated 2.01 billion tonnes of municipal solid waste were generated in 2016, and this number is expected to grow to 3.40 billion tonnes by
2050 under a business-as-usual scenario.
• The total quantity of waste generated in low-income countries is expected to increase by more than three times by 2050. Currently, the East Asia and
Pacific region is generating most of the world’s waste, at 23 percent, and the Middle East and North Africa region is producing the least in absolute
terms, at 6 percent. However, waste is growing the fastest in Sub-Saharan Africa, South Asia, and the Middle East North Africa regions, where, by
2050, total waste generated is expected to approximately triple, double, and double, respectively.
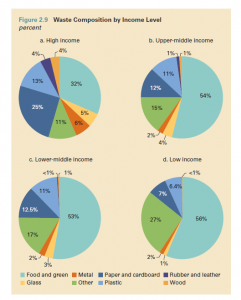
• Food and green waste comprise more than 50 percent of waste in low- and middle-income countries. In high-income countries the amount of organic
waste is comparable in absolute terms but, because of larger amounts of packaging waste and other nonorganic waste, the fraction of organics is
about 32 percent.
• Recyclables make up a substantial fraction of waste streams, ranging from 16 percent paper, cardboard, plastic, metal, and glass in low-income countries
to about 50 percent in high-income countries. As countries rise in income level, the quantity of recyclables in the waste stream increases,
with paper increasing most significantly.
• Waste collection rates vary widely by income levels. High- and upper-middle income countries typically provide universal waste collection. Low-income
countries tend to collect about 48 percent of waste in cities, but outside of urban areas waste collection coverage is about 26 percent. In middle income
countries, rural waste collection coverage varies from 33 percent to 45 percent.
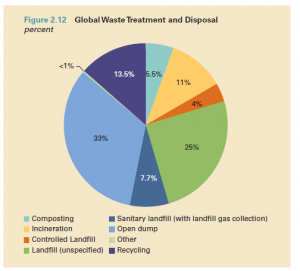
• Globally, about 37 percent of waste is disposed of in some type of landfill, 33 percent is openly dumped, 19 percent undergoes materials recovery
through recycling and composting, and 11 percent is treated through modern incineration.
• Adequate waste disposal or treatment using controlled landfills or more stringently operated facilities is almost exclusively the domain of high and
upper-middle-income countries. Lower-income countries generally rely on open dumping—93 percent of waste is dumped in low-income
countries and only 2 percent in high-income countries.
• Upper-middle-income countries practice the highest percentage of landfilling, at 54 percent. This rate decreases in high-income countries to
39 percent, where 35 percent of waste is diverted to recycling and composting and 22 percent to incineration.
Waste Generation
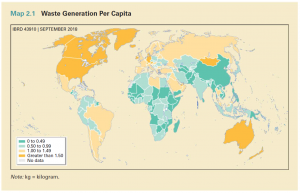
Waste generation is a natural product of urbanization, economic development, and population growth. As nations and cities become more
populated and prosperous, offer more products and services to citizens, and participate in global trade and exchange, they face corresponding amounts
of waste to manage through treatment and disposal (map 2.1). The 2012 edition of What a Waste: A Global Review of Solid Waste Management estimated global waste production to be 1.3 billion tonnes per year based on available data (Hoornweg and Bhada-Tata 2012). In recent years, waste production has grown at levels consistent with initial projections, and data tracking and reporting have improved substantially. Based on the latest data available, global waste generation in 2016 was estimated
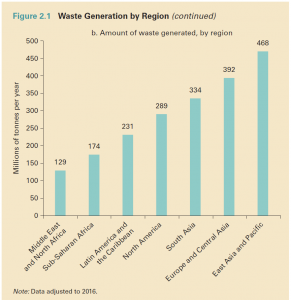
to have reached 2.01 billion tonnes. Countries in the East Asia and Pacific and the Europe and Central Asia regions account for 43 percent of the world’s waste by magnitude ( figure 2.1, panel a). The Middle East and North Africa and Sub-Saharan Africa regions produce the least amount of waste, together accounting for 15 percent of the
world’s waste. East Asia and Pacific generates the most in absolute terms, an estimated 468 million tonnes in 2016, and the Middle East and North Africa
region generates the least, at 129 million tonnes (figure 2.1, panel b).
Although they only account for 16 percent of the world’s population, high-income countries generate 34 percent, or 683 million tonnes, of the
world’s waste (figure 2.2). Low-income countries account for 9 percent of the world’s population but generate only about 5 percent of global waste,
or 93 million tonnes. The three countries in the North America region—Bermuda, Canada, and the United States—produce the highest average amount of waste per capita,
at 2.21 kilograms per day. All three countries are high-income nations. The three regions with a high proportion of low- and middle-income nations generate
the lowest amount of waste per capita: Sub-Saharan Africa averages 0.46 kilogram per day, South Asia 0.52 kilogram per day, and East Asia and
Pacific 0.56 kilogram per day. Overall, the estimated global average for 2016 is 0.74 kilogram of waste per capita per day and total generation of solid
waste is about 2.01 billion tonnes.
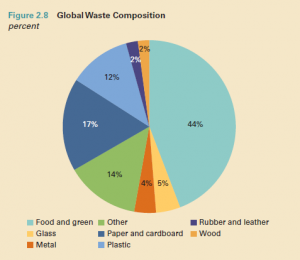
Waste Composition
Waste composition is the categorization of types of materials in municipal solid waste. Waste composition is generally determined through a
standard waste audit, in which samples of garbage are taken from generators or final disposal sites, sorted into predefined categories, and
weighed. At an international level, the largest waste category is food and green waste, making up 44 percent of global waste (figure 2.8). Dry recyclables
(plastic, paper and cardboard, metal, and glass) amount to another 38 percent of waste. Waste composition varies considerably by income level (figure 2.9). The
percentage of organic matter in waste decreases as income levels rise. Consumed goods in higher-income countries include more materials such
as paper and plastic than they do in lower-income countries. The granularity of data for waste composition, such as detailed accounts of rubber and
wood waste, also increases by income level.
Global Food Loss and Waste
Across global food systems, food loss and waste (FLW) is a widespread issue, posing a challenge to food security, food safety, the economy, and environmental sustainability. No accurate estimates of the extent of FLW are available, but studies indicate that FLW is roughly 30 percent of all food globally (FAO 2015). This amounts to 1.3 billion tonnes per year. FLW represents wastage of resources, including the land, water, labor, and energy used to produce food. It strongly contributes to climate change because greenhouse gases are emitted during food production and distribution activities, and methane is released during the decay of wasted food. FLW also affects food supply chains by lowering income for food producers, increasing costs for food consumers, and reducing access to food. Minimizing FLW could lead to substantial food security
and environmental gains. The causes of FLW vary across the world and depend on specific local conditions. Typically, FLW in low-income countries occurs at the production, postharvest handling, storage, and processing stages and is caused predominantly by managerial and technical limitations. FLW mostly occurs in the distribution and consumption stages in middle- and high-income countries, although it can happen in earlier stages such as when agricultural subsidies lead to overproduction
of farm crops. These challenges relate to consumer behavior and government policies and regulation.
Improving coordination among actors along the different stages of the supply chain could address some of the FLW issues globally. Measures to reduce FLW in low-income countries could involve investment in infrastructure and transportation, including in technology for storage and cooling. Small-scale farmers could also be supported by provision of improved financing and credit to allow them to diversify or scale their production. In high-income countries, consumer education for behavior change is key to decreasing FLW. In addition to decreasing FLW along the supply chain, discarded food could also be managed productively for composting and energy recovery.
Regional and international stakeholders are taking action to address FLW. The African Union is working with 14 governments to translate the “Malabo Declaration on Accelerated Agricultural Growth and Transformation for Shared Prosperity and Improved Livelihoods,” including food loss reduction, into proper national policy and strategies in Africa (African Union Commission 2014). The Deputy-Secretary General of the United Nations called on all partners to adopt a more holistic
approach to food security, one that prioritizes FLW, builds new coalitions, scales up current work, and innovates (Helvetas 2018). The Food and Agriculture Organization has been working on developing new metrics and methodologies to measure FLW, and the organization’s SAVE FOOD Initiative works with civil society to address the issue (FAO 2018). The World Food Programme is including food loss as part of some five-year country plans in Africa and launched the Farm to Market Alliance
to structure local markets and promote loss reduction technologies among smallholder farmers (World Food Program 2017). The World Bank is tackling the issue through loans, such as in Argentina, and by coordinated food waste management and the establishment of a cross-sectoral strategy (World Bank 2015).
Several national and local governments have also taken action. In 2016, the government of Italy approved a law to enhance collaboration among key stakeholders, educate the public, encourage food donations from business through financial incentives, and promote reusable and recyclable packaging (Azzuro, Gaiani, and Vittuari 2016). In 2016, France became the first country in the world to ban supermarkets from throwing away or destroying unsold food, forcing them instead to donate
it to charities and food banks (Chrisafis 2016). In 2009, the city of San Francisco in the United States passed an ordinance requiring all residents and tourists to compost food waste (McClellan 2017). The city of Ningbo in China diverts food waste from apartment buildings to an anaerobic digestion facility (Lee et al. 2014). In several cities in Sweden, biogas is produced from food waste to power vehicles and generate heat (Swedish Gas Centre, Swedish Gas Association, and Swedish Biogas Association 2008). In cities like Linköping, Sweden, the majority of public buses have been converted to use recovered biogas. The optimal strategy to reduce loss and recover food waste depends
greatly on the local context, but the increasing global action reveals the many policy, technology, and educational avenues available.
Waste Collection
Waste collection is one of the most common services provided at a municipal level. Several waste collection service models are used across the
globe. The most common form of waste collection is door-to-door collection. In this model, trucks or small vehicles—or, where environments
are more constrained, handcarts or donkeys—are used to pick up garbage outside of households at a predetermined frequency. In certain
localities, communities may dispose of waste in a central container or collection point where it is picked up by the municipality and transported to
final disposal sites. In other areas with less regular collection, communities may be notified through a bell or other signal that a collection vehicle
has arrived in the neighborhood, such as in Taiwan, China. Waste collection rates in high-income countries and in North America are near 100 percent. In lower-middle-income countries, collection rates are about 51 percent, and in low-income countries, about 39 percent. In low-income countries, uncollected waste is often managed independently by households and may be openly dumped, burned, or, less commonly, composted. Improvement of waste collection services is
a critical step to reduce pollution and thereby to improve human health and, potentially, traffic congestion. Waste collection rates tend to be substantially higher for urban areas than for rural areas, since waste management is typically an urban service. In lower-middle-income countries, waste collection rates are more than
twice as high in cities as in rural areas.
Waste Disposal
Around the world, almost 40 percent of waste is disposed of in landfills (figure 2.12).3 About 19 percent undergoes materials recovery through
recycling and composting,4 and 11 percent is treated through modern incineration. Although globally 33 percent of waste is still openly
dumped, governments are increasingly recognizing the risks and costs of dumpsites and pursuing sustainable waste disposal methods.
Waste disposal practices vary significantly by income level and region. Open dumping is prevalent in lower-income countries,
where landfills are not yet available. About 93 percent of waste is burned or dumped in roads, open land, or waterways in low-income countries,
whereas only 2 percent of waste is dumped in high-income countries. More than two-thirds of waste is dumped in the South Asia and Sub-
Saharan Africa regions, which will significantly impact future waste growth. As nations prosper economically, waste is managed using more sustainable
methods. Construction and use of landfills is commonly the first step toward sustainable waste management. Whereas only 3 percent of waste is deposited in landfills in low-income countries, about 54 percent of waste is sent to landfills in upper-middle-income countries. Furthermore, wealthier countries tend to put greater focus on materials recovery through recycling and composting. In high-income countries, 29 percent of waste is recycled and 6 percent composted. Incineration is also more common. In high income countries, 22 percent of waste is incinerated, largely within high capacity and land-constrained countries and territories such as Japan and
the British Virgin Islands.
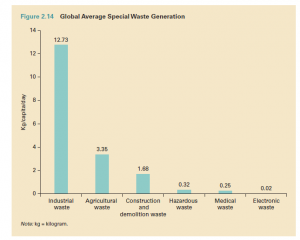
Special Wastes
Municipal solid waste is one of several waste streams that countries and cities manage. Other common waste streams include industrial waste,
agricultural waste, construction and demolition waste, hazardous waste, medical waste, and electronic waste, or e-waste (figure 2.14). Some waste streams, such as industrial waste, are generated in much higher quantities than municipal solid waste. For the countries with available industrial waste generation data, the trend shows that globally, industrial waste generation is almost 18 times greater than municipal solid waste. Generation of industrial waste rises significantly as income level increases.
Global agricultural waste production is more than four and a half times that of municipal solid waste. Agricultural waste is most significant in countries
with large farming industries. Agricultural waste is often managed separately from other waste streams since it is largely organic and may serve
as a useful input for future agricultural activities. Construction and demolition waste may compete with municipal solid waste for disposal space in landfills. In some countries, such as India, it is common to dispose of both in the same disposal facilities. Hazardous, medical, and e-waste are typically only a fraction of
municipal solid waste. If disposed of properly, these wastes are typically treated in specialized facilities, including chemical processing plants, incinerators, and disassembly centers, respectively. The generation of e-waste is associated with economic development, with high-income countries generating five times the volume of e-waste generated by lower middle-income countries. The increasing amount of e-waste and its potential for environmental pollution and recycling may be an area of
consideration for rapidly developing countries.